
Building NEC data-interpretation skills means training three habits: reading economic tables for the one figure that matters, decoding index numbers (especially CPI and base years), and doing fast percentage-change and real-value calculations without a calculator. The National Economics Challenge (NEC), run by the Council for Economic Education (CEE), rewards students who turn raw numbers into an argument quickly. This guide gives you a practice method, not just theory.
Why numerical data is the quiet differentiator in the NEC
The NEC covers microeconomics, macroeconomics, and the world/international economy, and roughly 10,000 US students compete each year. Across its rounds — the Qualifying Test, Super Econ, Quiz Bowl, Critical Thinking, Econ Lab, Econ Immersion, and U20 Youth Voice — most participants can recite definitions. Far fewer can look at an unfamiliar table of inflation, GDP, or trade figures and extract the right insight under time pressure.
That gap is where data interpretation lives. It is not about advanced statistics. It is about three repeatable moves: (1) orient quickly to what a table is measuring, (2) convert index numbers into something comparable, and (3) compute changes fast enough that the analysis — not the arithmetic — is what eats your time. For CNEC students preparing in China, this is also the most transferable skill, because the same habits carry directly into A-Level, IB, and AP economics data-response questions.
This article deliberately stays on numerical data — tables, indices, and quick math. It does not cover reading economic diagrams (supply-and-demand or AD-AS curves) or walk through the Econ Lab round itself; those are separate skills with their own practice routines. Here, the unit of study is the number.
Reading economic tables: a four-step orientation drill
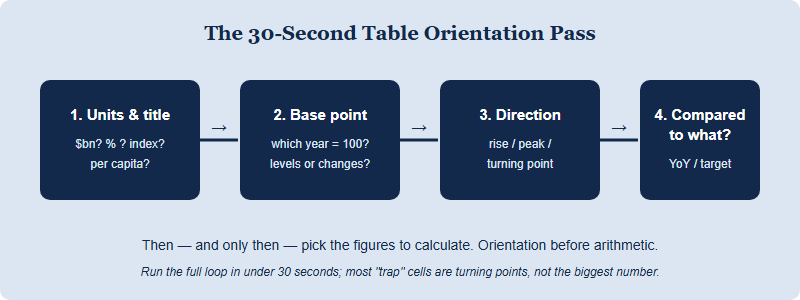
When a table appears, untrained students read top-to-bottom and drown in figures. Trained students orient first. Practise this four-step pass on every table you meet until it becomes automatic — aim to complete it in under 30 seconds before you compute anything.
- Step 1 — Read the units and the title. Is this in billions of dollars, percentages, an index (no unit), or a per-capita figure? A misread unit invalidates everything after it.
- Step 2 — Identify the base or reference point. For an index, find the year set to 100. For a growth table, find whether figures are levels or already expressed as changes.
- Step 3 — Find the direction and the turning point. Scan for where a series rises, peaks, or reverses — the single most “examinable” cell is usually a turning point, not the largest number.
- Step 4 — Ask “compared to what?” A figure alone says little; the analysis is in the comparison (year-on-year, country-vs-country, or against a stated target).
The figure below shows the orientation pass as a loop you run on any dataset.
Decoding index numbers and base years
Index numbers confuse more NEC candidates than any other single data type. The core idea is simple: an index expresses a value relative to a base period set to 100. The Consumer Price Index (CPI) is the most common example, but the same logic applies to production indices, stock indices, and trade-weighted indices.
Three rules unlock almost every index question:
- An index has no units. A CPI of 118 does not mean “118 dollars” — it means prices are 18% higher than in the base year, where the base = 100.
- Percentage change between two index values is the change in points divided by the starting value. From 110 to 121 is (121 − 110) / 110 = 10%, not “11 points = 11%”. The points-versus-percent confusion is the classic trap.
- Inflation is the percentage change in the price index, not the index level. A rising CPI that rises more slowly means inflation is falling (disinflation) while prices are still going up — a distinction graders love to test.
The table below is a worked example you can re-create as a practice template. Cover the right column, compute, then check.
| Year | CPI (base year = 100) | Inflation rate vs previous year |
|---|---|---|
| Base year | 100 | — |
| Year 1 | 104 | (104 − 100) / 100 = 4.0% |
| Year 2 | 110 | (110 − 104) / 104 ≈ 5.8% |
| Year 3 | 113 | (113 − 110) / 110 ≈ 2.7% |
Practice tip: build five or six of these tables yourself with invented numbers and fill the inflation column from memory. The act of generating the data, not just reading it, is what cements the base-year logic. This is the kind of drill our CNEC coaching desk uses early in a team's preparation, before any past-paper work, because a team that fumbles index arithmetic in Round 1 never gets to show its analysis.
Fast percentage and real-value calculations without a calculator
Speed in mental arithmetic frees up thinking time. You do not need to be a human calculator — you need a handful of approximation tricks that get you to a defensible figure in seconds. Confirm exact exam rules, including whether and when calculators are permitted in any given CNEC round, on the official CNEC channels; build your practice to work both with and without one.
- Percentage change shortcut. For small changes, (new − old) / old. For a quick estimate, 1% of a number is that number with the decimal moved two places — scale up from there.
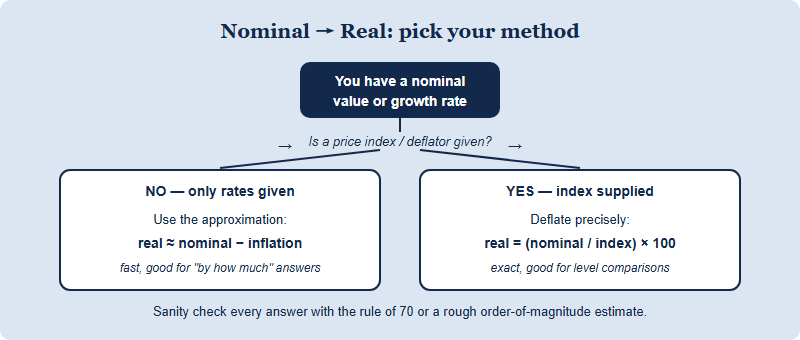
- The real-value rule. Real value ≈ nominal value adjusted for inflation. A rough, exam-friendly version: real growth ≈ nominal growth − inflation rate. If wages rise 6% but inflation is 4%, real wages rise roughly 2%.
- Deflating with an index. Real value = (nominal value / price index) × 100. Use this when a table gives you nominal GDP and a deflator and asks for real GDP.
- The rule of 70. Years to double ≈ 70 / growth rate (%). A 7% growth rate doubles output in about a decade — a fast sanity check for any “how long until…” question.
The diagram below maps the most common NEC numerical task — turning a nominal figure into a real one — into a single decision path.
From numbers to argument: the analytical habit graders reward
Calculation is the floor, not the ceiling. The NEC's analytical rounds reward students who use a computed figure to support a claim. A strong data answer follows a three-beat structure: state the number, interpret what it means economically, then connect it to a concept or a likely cause.
Compare the two responses below to the same table cell — “real wages fell roughly 2% last year.”
| Weak answer (number only) | Strong answer (number → meaning → cause) |
|---|---|
| “Real wages fell by about 2%.” | “Real wages fell about 2%, so households' purchasing power declined even though pay rose in cash terms — consistent with inflation outpacing nominal wage growth.” |
| Stops at the figure; no economics. | Links the figure to purchasing power and to the nominal-vs-real distinction. |
To build this habit, end every practice calculation with the phrase “which means…” and force yourself to finish the sentence. Over a few weeks, the interpretation becomes reflexive. For a wider view of how the rounds fit together and where data-heavy questions appear, see the official CNEC site; for division-level expectations on quantitative depth, check the current rules and format pages there, and review the CNEC competition overview before you build a study schedule.
A four-week data-interpretation practice plan
Skills compound when practice is structured. Here is a lightweight progression a student can run alongside regular coursework. It is illustrative, not an official CNEC syllabus — confirm round formats and any rule changes on the official CNEC channels.
- Week 1 — Orientation. Run the 30-second table pass on one new table per day. Goal: never miss the units or the base year.
- Week 2 — Indices. Build and fill your own CPI tables; drill points-versus-percent until the trap stops catching you.
- Week 3 — Real values. Practise both the approximation rule and index deflation on the same datasets; compare your two answers and explain the gap.
- Week 4 — Argument. Take every figure to a “which means…” sentence; time yourself so analysis, not arithmetic, dominates the clock.
Students who train this way arrive at the NEC able to treat an unfamiliar table as an opportunity rather than a threat — which, in a timed economics competition, is exactly the edge that separates strong teams from the field.
Frequently asked questions
Do I need advanced statistics for NEC data questions?
No. Core skills are reading tables, decoding index numbers, and percentage and real-value math. Solid arithmetic and clear interpretation matter far more than statistics.
What is the most common data-interpretation mistake?
Confusing index points with percentages. A move from 110 to 121 is an 11-point but 10% change — divide the change by the starting value, not by 100.
Can I use a calculator in the NEC rounds?
Rules vary by round and can change, so confirm on the official CNEC channels. Practise mental approximation either way; it saves time you can spend on analysis.
How is “real” different from “nominal”?
Nominal is the cash figure; real adjusts for inflation. A quick estimate is real growth ≈ nominal growth − inflation; for levels, deflate with the price index.
Published by the NEC / CNEC editorial desk, operated by Hanlin Education as the officially authorized China National Economics Challenge (CNEC) test center. The NEC is run by the Council for Economic Education, which sets the official rules — always confirm current dates, divisions, fees and awards on the official CNEC channels. Any error will be corrected within 7 working days.