
Read the axes, name the curves, identify what moved and why, and only then look at the answer options. Almost every avoidable graph error in economics comes from reversing that order. Where the format allows about a minute per question and bars calculators, as CEE’s rules do for its own semi-finals, diagram fluency is not decoration — it is the fastest route to a defensible answer.
A sixty-second budget, and the seven families it has to cover
CEE’s published rules for the 2026 National Economics Challenge state that its Online National Semi-Finals give students 45 minutes to answer 45 four-option multiple-choice questions, with books, notes, calculators and the internet all prohibited. Whatever your own round’s format turns out to be — formats and stage structures are set by the competition and change yearly, so confirm them officially — the arithmetic of a test like that is instructive. A minute a question is generous for recall and brutal for reconstruction.
That distinction matters more for graphs than for anything else. If you already own a diagram, a graph question is faster than a verbal one: you glance, you see which curve moved, you read off the direction. If you do not own it, the same question becomes a three-minute rebuild in which you re-derive the model from first principles while the clock eats the questions you could have answered. Students rarely lose a test on the hard questions. They lose it on four rebuilds.
The diagram families below are our own teaching taxonomy rather than an official syllabus list, but they map onto the three content areas CEE names — microeconomics, macroeconomics and international economics — and they cover most of the reasoning you will be asked to do.
| Diagram family | Area | The question it answers | The trap |
|---|---|---|---|
| Production possibilities frontier | Micro | What must you give up to get more of something? | Reading a point inside the curve as “efficient but small” rather than as unemployed resources |
| Supply and demand | Micro | Which way do price and quantity move after a shock? | Confusing a movement along a curve with a shift of the curve |
| Elasticity and tax incidence | Micro | Who actually bears a tax or gains from a subsidy? | Assuming the side that legally pays is the side that bears it |
| Cost curves and market structure | Micro | How much does a firm produce, and does it earn abnormal profit? | Reading profit off the wrong vertical distance, or forgetting the short run and long run differ |
| Aggregate demand and aggregate supply | Macro | What happens to output and the price level after a shock? | Treating the vertical axis as “price” rather than the price level, and importing micro intuitions unchanged |
| Trade, tariffs and comparative advantage | International | Who gains, who loses, and what is lost outright? | Counting the tariff revenue rectangle as a loss instead of a transfer |
| Foreign exchange markets | International | Which way does a currency move, and why? | Forgetting the axis is a price of one currency in terms of another, so “up” depends on which currency you drew |
Seven families is a small enough set to genuinely own before a season starts. It is also small enough that the honest test of your preparation is simple: can you draw all seven from a blank page, labelled, in under fifteen minutes? Most students who believe they have studied economics cannot, and the gap between believing and drawing is exactly where points go.
The four-step read order
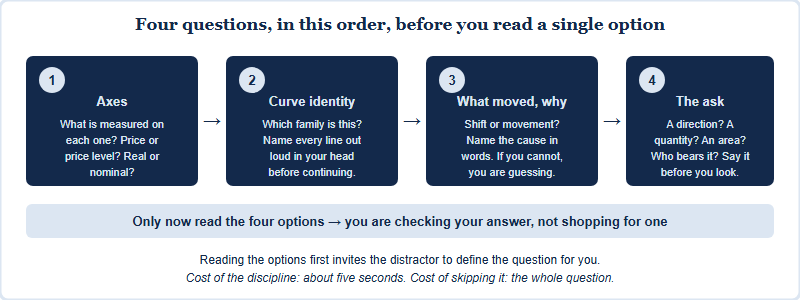
Step four deserves emphasis because it is the one students skip when they are behind on time. Diagram questions in economics ask several structurally different things — a direction of change, a specific quantity, an area representing welfare or revenue, or an incidence question about who bears a burden. Answering the wrong type correctly still scores nothing.
The misread that costs the most
If you fix one thing this season, fix this one. It appears in every micro topic, it reappears in macro wearing different clothes, and it is responsible for more confidently wrong answers than any other single confusion in introductory economics.
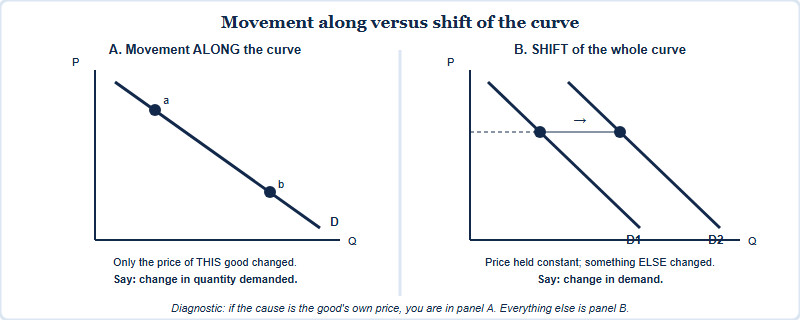
Four more misreads are worth rehearsing until they are automatic.
- Nominal versus real. A quantity that rises in nominal terms may have fallen in real terms. If a question mentions inflation at all, check which one the axis is measuring before you answer.
- Short run versus long run. Several models give opposite answers in the two horizons. A firm can rationally keep producing at a loss in the short run and cannot in the long run; the same is true of several macro results.
- Transfer versus loss. On a tariff or tax diagram, some areas move from one party to another and some vanish. Only the vanished area is deadweight loss. Students routinely add government revenue to the welfare loss and produce an answer that is confidently too large.
- Legal incidence versus economic incidence. Who writes the cheque is a legal fact; who bears the burden is determined by relative elasticity. The more inelastic side pays more, whatever the statute says.
Diagrams in the live rounds
Diagram fluency is not only a multiple-choice asset, and this is where a test-and-team competition differs most sharply from a written essay prize — a distinction we set out in full in NEC versus the economics essay prizes. CEE’s rules for its National Finals describe a Critical Thinking Round in which teams have 25 minutes to prepare an analysis of a current economic problem, 12 minutes to present it and 8 minutes to answer judges’ questions, working from a blank slide deck with no speaker notes permitted. Judges score on completeness of response, economic analysis and insight, background knowledge, presentation, and responses to their questions.
Read that scoring list again with a graph in mind. A team that can put one clean, correctly labelled diagram on a slide and talk through it has produced analysis and insight in about ninety seconds. A team that writes three bullet points of prose has produced assertion. When the judges’ questions come — and eight minutes is a long time under interrogation — the diagram is also what you defend from, because it makes your assumptions visible and therefore arguable rather than vague. For how the stages fit together and what each one is really testing, see our breakdown of the seven NEC rounds.
In rapid oral rounds the constraint flips again. CEE’s Quiz Bowl rules give teams 20 seconds to confer before writing an answer. Twenty seconds is not enough to draw anything; it is barely enough to picture something you already own. That is the whole argument for building diagram fluency months in advance rather than weeks.
Three drills that actually build it
- The blank-page seven. Once a week, reproduce all seven families from memory with axes and curves labelled. Time it. When you can do it in under fifteen minutes without hesitating over an axis, the recall problem is solved and you can move on to reasoning.
- Narrate the shift. Take any economic news story and say aloud which diagram it belongs to, which curve moves, in which direction, and why — in one sentence, without drawing. This is the drill that converts diagram knowledge into the language judges and question-writers actually use.
- The sixty-second cold read. Practise graph questions with a timer set to a minute, forcing yourself through the four-step order every time even when the answer seems obvious. The point is not speed; it is making the order automatic so that it survives the moment you are behind on the clock.
Among students one of our coaches has worked with in past cycles, including some who went on to Oxford and to Chicago, the recurring habit was unglamorous: they committed to the diagram before they looked at the options, and they kept a redraw deck they rebuilt from memory rather than reread. We would not claim any competition result caused any admission outcome, and nobody should. But the method transfers, which is more than can be said for most exam tricks — and if you are weighing whether to attempt the advanced track, the honest first test is whether these seven diagrams are automatic yet, a question our guide to the Adam Smith division takes up directly.
Frequently asked questions
How many diagram questions will there be?
Round composition is set by the competition and changes yearly — confirm on councilforeconed.org and through official CNEC channels. Diagram reasoning underpins all three named content areas regardless.
Shift or movement — is there a quick test?
Yes. Ask what caused the change. If it is the price of that good itself, it is a movement along the curve. Anything else shifts the whole curve.
Should I redraw diagrams or just review them?
Redraw. Reviewing produces recognition, which fails the moment a question is phrased unfamiliarly. Drawing from a blank page is the only honest test.
Are diagrams useful in the live presentation rounds?
Very. CEE’s Critical Thinking Round scores economic analysis and insight and requires a blank starting deck, so a labelled diagram carries argument faster than prose bullets.
Published by the NEC (CNEC) editorial desk, operated by Hanlin Education for China-based international-school students. Official rules are set by the competition and change yearly — confirm current details on councilforeconed.org and through the official CNEC channels. Errors are corrected within 7 working days.