
The National Economics Challenge (NEC) tests development economics as one question: is a country's population actually better off, not just producing more? To earn the marks you separate economic growth (a bigger GDP) from economic development (rising living standards, health, education and reduced inequality), measure development with broader tools than GDP per capita — above all the Human Development Index and inequality measures — and explain the barriers that keep poor economies poor.
Growth is not development: the distinction the world-economy section rewards
The first thing development items check is whether you can keep two ideas apart. Economic growth is a rise in real output — more goods and services, captured by real GDP. Economic development is the broader, qualitative improvement in well-being: longer and healthier lives, more education, less absolute poverty, wider access to clean water and electricity, and a more equal distribution of the gains. Growth is usually necessary for development, but it is not sufficient: an economy can grow while the benefits pool at the top, the environment degrades, or public health stagnates. NEC prompts in the world-economy section hand you a country with rising GDP and ask whether its people are better off — and the disciplined answer reaches past the headline output figure.
This is a different question from the long-run growth topic that asks what makes potential output rise (capital, human capital, technology and total factor productivity). Here the output number is taken as given, and the examiner's interest is in how that output is shared and what it does for human lives. Treat “growth” as the engine and “development” as the destination, and the section's items become readable.
- Growth: a quantitative rise in real GDP — more output this year than last.
- Development: a qualitative rise in living standards — health, education, equity, opportunity.
- The NEC trap: equating “GDP went up” with “the country developed.” State why the two can diverge.
Measuring living standards beyond GDP: why GDP per capita is not enough
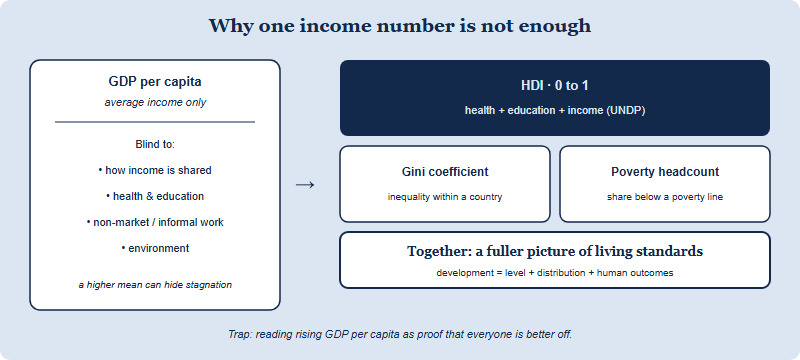
A large family of development questions exists to test the limits of GDP per capita as a welfare measure. As an average, it hides distribution: a country can raise mean income while most households see nothing, because a small group captured the gains. It ignores non-market activity (unpaid household and care work), says nothing about health, education or leisure, and counts “bads” such as pollution clean-up or congestion as additions to output. It also overlooks the informal economy, which is large in many developing countries. The mark-winning answer names these gaps and then reaches for measures built to fill them.
The headline alternative is the Human Development Index (HDI), published by the United Nations Development Programme, which combines three dimensions into a single score between 0 and 1: a long and healthy life (life expectancy), knowledge (education), and a decent standard of living (income per capita). Because it blends health and education with income, the HDI can rank a country differently from raw GDP per capita — and that gap is exactly what NEC items probe. Treat the HDI's precise indicators and weighting as something to confirm on current UNDP sources rather than to assert from memory; what the examiner wants is that you grasp why a composite, multi-dimensional index captures development better than a single income figure.
| Measure | What it captures | Key blind spot | NEC use |
|---|---|---|---|
| Real GDP per capita | Average output / income per person | Distribution, health, non-market work | Baseline — then critique it |
| Human Development Index (HDI) | Health + education + income (0–1) | Inequality, environment, freedoms | Headline “beyond-GDP” index |
| Gini coefficient | Income inequality (0 = equal, 1 = max) | Says nothing about average level | Distribution within a country |
| Poverty headcount | Share below a poverty line | Depth of poverty below the line | Absolute deprivation |
Inequality: the Gini coefficient and the Lorenz curve
Because development is partly about who gains, inequality is a recurring NEC theme, and the standard tools are the Lorenz curve and the Gini coefficient. The Lorenz curve plots the cumulative share of income against the cumulative share of the population, ranked from poorest to richest; the further it bows away from the 45-degree line of perfect equality, the more unequal the distribution. The Gini coefficient turns that gap into a single number between 0 (everyone has the same income) and 1 (one person has everything) — the area between the Lorenz curve and the equality line, as a share of the whole triangle. A data-interpretation item may show two Lorenz curves and ask which country is more unequal; the one bowed further out, with the higher Gini, is the answer.
The evaluation marks come from reasoning about inequality, not just measuring it. NEC Critical Thinking prompts test whether you can argue both sides: some inequality can sharpen incentives to work, save and innovate, but high inequality can entrench poverty, limit access to education and health, and weaken the broad-based demand and human-capital formation that development needs. The disciplined answer treats the “right” level of inequality as a trade-off a society weighs, and notes that two countries with the same average income can be very different places to live depending on how that income is spread.
- Lorenz curve: the visual — cumulative income share vs. cumulative population share.
- Gini coefficient: the number — 0 (perfect equality) to 1 (maximum inequality).
- The NEC nuance: the Gini says nothing about the level of income, so always pair it with an average measure.
Barriers to development: why some economies stay poor
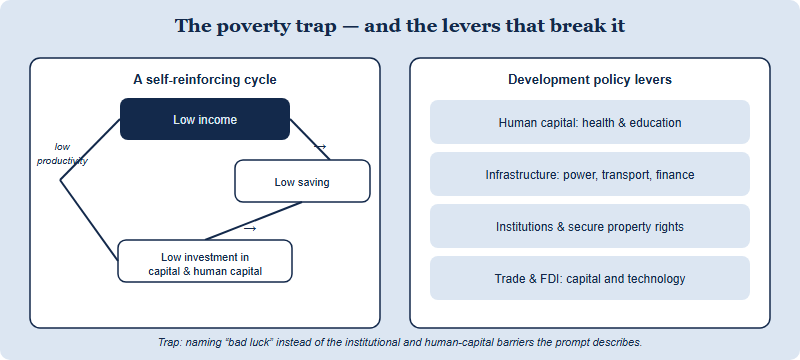
The richest development questions ask why low-income economies struggle to develop — and reward students who name concrete barriers rather than gesturing at “bad luck.” The classic mechanism is the poverty trap (or savings trap): low incomes mean low saving, low saving means little investment in capital and human capital, and weak investment keeps productivity and incomes low — a self-reinforcing circle that growth alone struggles to break. Around it sit the structural barriers that NEC examiners look for you to identify in a country description.
- Weak institutions: insecure property rights, corruption and an unreliable rule of law deter the investment and enterprise development needs.
- Human-capital deficits: poor health and limited schooling cap productivity — a workforce cannot use better technology it was never trained to operate.
- Missing infrastructure and capital: unreliable power, transport and finance raise costs and choke off investment.
- Dependence on primary products: economies reliant on a few commodity exports face volatile prices and, often, deteriorating terms of trade.
- Debt and limited access to finance: high debt-service burdens and shallow financial markets crowd out development spending.
When an item asks why two economies with similar resources diverged, the answer runs through these barriers — especially institutions and human capital — not through luck. This is also where development links back to the trade material in the world-economy section: openness to trade and foreign investment can ease capital and technology constraints, but commodity dependence can leave a country exposed. State the barrier the prompt is testing, then the development policy that targets it, and you are answering the question the examiners actually set.
Development scenarios: reading the trade-offs NEC sets
Critical Thinking and Econ Lab items often present a development scenario — a government choosing between policies, or an economy weighing a strategy — and ask you to evaluate the trade-offs. The recurring tensions are worth rehearsing because the same shapes return. Growth versus equity: a policy may lift average income while widening the Gini, so the answer weighs the size of the gain against its distribution. Present versus future: resources spent on consumption today (food, transfers) compete with investment in education and infrastructure that pays off over decades. Growth versus the environment: rapid industrial growth can raise output and HDI income while degrading the natural capital future development relies on — the sustainability point examiners reward.
The mark-winning habit is to refuse a one-word verdict. A strong answer says for whom, over what horizon, and at what cost a development strategy works, and ties the judgement back to a measure — will this raise the HDI, narrow the Gini, or cut the poverty headcount, and for which group? That is the evaluative, multi-dimensional reasoning the world-economy section is built to test, and it is the same discipline rewarded across the official rounds — map the current format against the official CNEC channels before relying on any specific structural detail.
How to drill development economics for the NEC rounds
Development rewards a compact set of distinctions applied at speed. The Qualifying Test and Quiz Bowl punish hesitation on definitions (HDI components, what the Gini measures), while Critical Thinking and the Econ Lab reward the conceptual reads on inequality, barriers and trade-offs. A first-party drilling routine we use with CNEC teams:
- Open every development answer by splitting growth from development. Name whether the prompt is about more output or better living standards before you evaluate.
- Reach past GDP per capita on sight. When an item leans on an average income figure, flag distribution and human outcomes, and bring in the HDI, Gini or poverty headcount.
- Diagnose the barrier, then the lever. Identify which constraint the country description is testing — institutions, human capital, infrastructure, commodity dependence — and pair it with the policy that targets it.
- Answer scenarios with “for whom, over what horizon, at what cost.” Tie every development judgement back to a measure rather than a one-word verdict.
Development economics is one slice of the world-economy material the NEC tests, but it is the topic that explains why two economies with similar GDP can be very different places to live — so the precision you build here pays off across the trade, exchange-rate and policy questions too. To see where these world-economy items sit in the wider format and timeline, confirm the current structure on the official CNEC channels before relying on any specific detail.
FAQ
What is the difference between economic growth and economic development?
Growth is a rise in real output (GDP); development is the broader rise in living standards, health, education and equity.
Why does NEC look beyond GDP per capita?
As an average it hides distribution, health, education and non-market work — so development questions add the HDI, Gini and poverty measures.
What does the Gini coefficient measure?
Income inequality on a 0-to-1 scale: 0 is perfect equality, 1 is maximum inequality. It says nothing about the average income level.
What is a poverty trap in NEC development questions?
Low income keeps saving and investment low, which keeps productivity and income low — a self-reinforcing cycle that growth alone struggles to break.
Published by the NEC / CNEC editorial desk, operated by Hanlin Education as the officially authorized China National Economics Challenge (CNEC) test center. The NEC is run by the Council for Economic Education, which sets the official rules — always confirm current dates, divisions, fees and awards on the official CNEC channels. Errors are corrected within 7 working days.