Consumer choice is the theory underneath the demand curve. A consumer with a fixed budget gets the most total satisfaction by buying, unit by unit, whatever delivers the highest marginal utility per dollar, until the budget is spent and marginal utility per dollar is equal across goods. Secure that rule and its two supports, diminishing marginal utility and the budget line, and most questions on this topic turn into careful arithmetic.
A scope note first. NEC does not publish a topic list or weighting, and the Council for Economic Education describes the competition as testing core micro and macroeconomic principles alongside knowledge of the world economy. Consumer choice is standard principles microeconomics: the CEE's own EconEdLink platform hosts AP Microeconomics webinar material on Topic 1.6, Marginal Analysis and Consumer Choice. We treat it as in scope for David Ricardo and Adam Smith preparation, and as optional depth for Pre entrants.
Total utility, marginal utility and why the second one shrinks
Utility is satisfaction, counted in imaginary units so that choices can be compared. Total utility is the satisfaction from everything consumed. Marginal utility is the change in total utility from one more unit: the change in total utility divided by the change in quantity. Diminishing marginal utility says that, other things equal, each extra unit adds less than the one before. The first cup of bubble tea on a hot afternoon is worth a great deal; the sixth is worth very little.
| Cups of bubble tea | Total utility | Marginal utility | What the row teaches |
|---|---|---|---|
| 1 | 24 | 24 | The first unit carries the most extra satisfaction |
| 2 | 44 | 20 | Marginal utility falls while total utility rises |
| 3 | 60 | 16 | Falling marginal utility is not falling total utility |
| 4 | 72 | 12 | Each cup still adds something |
| 5 | 80 | 8 | The gain per cup keeps shrinking |
| 6 | 84 | 4 | Total utility is close to its peak |
| 7 | 84 | 0 | Total utility peaks where marginal utility reaches zero |
| 8 | 80 | −4 | Negative marginal utility: total utility falls |
The row that matters most for exam purposes is the seventh. Total utility is highest where marginal utility is zero, yet nobody paying a positive price stops there. A paying consumer stops much earlier, at the point where the next cup is no longer the best use of the next dollar. Everything that follows builds on that idea.
The budget line: intercepts, slope, shifts and pivots
Give the consumer $14, bubble tea at $2 a cup and sandwiches at $4 each. Every affordable combination satisfies $2 × cups + $4 × sandwiches ≤ $14, and the budget line is the set of combinations that spend the whole $14.
- Intercepts. Spending everything on tea buys 7 cups; spending everything on sandwiches buys 3.5 sandwiches. Each intercept is income divided by that good's price.
- Slope. With sandwiches on the horizontal axis, the slope is minus the sandwich price over the tea price: −4 ÷ 2 = −2. One sandwich costs two cups of tea, which is the opportunity cost the line displays.
- Income change. Raise income to $20 and the line shifts out in parallel, to 10 cups or 5 sandwiches. The slope does not change, because relative prices have not changed.
- Price change. Cut the sandwich price to $2 and the line pivots outward along the sandwich axis to 7, while the tea intercept stays at 7 cups. The slope flattens to −1.
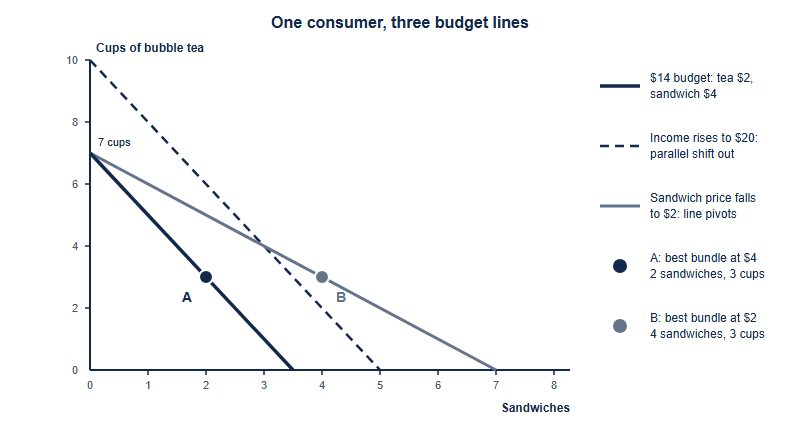
Two graph errors come from mixing those last two bullets: drawing a price change as a parallel shift, or giving an income change a new slope. If only one price changes, one intercept must stay exactly where it was.
The per-dollar rule, worked step by step
Now combine the two ideas. Sandwiches have their own diminishing marginal utility, and dividing each good's marginal utility by its price gives marginal utility per dollar:
| Unit | Tea: marginal utility | Tea: per dollar at $2 | Sandwich: marginal utility | Sandwich: per dollar at $4 |
|---|---|---|---|---|
| 1st | 24 | 12 | 40 | 10 |
| 2nd | 20 | 10 | 32 | 8 |
| 3rd | 16 | 8 | 24 | 6 |
| 4th | 12 | 6 | 16 | 4 |
| 5th | 8 | 4 | 8 | 2 |
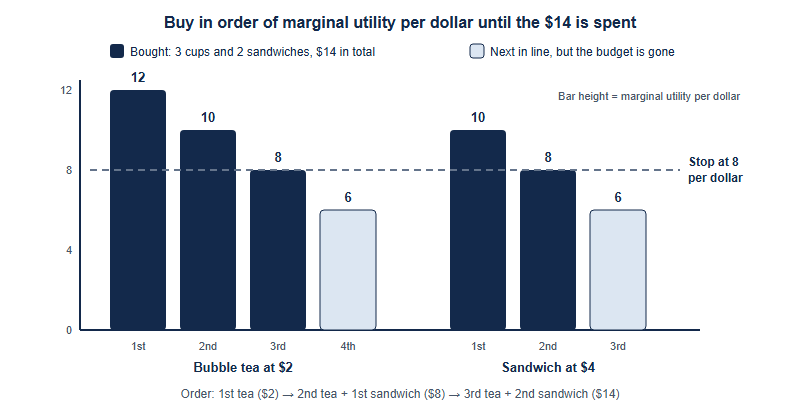
Then buy down the per-dollar columns, always taking the highest number still available:
- The first tea gives 12 per dollar, the best on offer. Spent so far: $2.
- The second tea and the first sandwich tie at 10 per dollar. Buy both. Spent so far: $8.
- The third tea and the second sandwich tie at 8 per dollar. Buy both. Spent so far: $14, and the budget is gone.
The result is 3 cups of tea and 2 sandwiches. The last unit of each good gives 8 units of utility per dollar, the whole budget is spent, and total utility is 24 + 20 + 16 + 40 + 32 = 132. Check it against the other ways to spend exactly $14: 5 teas and 1 sandwich give 120, 1 tea and 3 sandwiches give 120, and 7 teas alone give 84. The rule finds the best bundle without testing every combination. With whole units the two ratios will not always match exactly; the rule then means getting them as close as the units allow while spending the budget.
The traps that cost marks on this topic
From coaching this topic, the error we see most often is not a gap in understanding. Students grasp diminishing marginal utility perfectly and then forget that the two goods carry different prices. Rank by marginal utility alone and sandwiches look better, because their utility numbers are bigger: the first sandwich (40), the second (32), then the first tea and the third sandwich tie at 24. That spends the $14 on 1 tea and 3 sandwiches, for total utility of 120 instead of 132. Sandwiches deliver more satisfaction per unit, but each unit costs twice as much.
| Trap | What it looks like | The fix |
|---|---|---|
| Ranking by marginal utility, not marginal utility per dollar | Choosing the good with the bigger utility number when prices differ | Build the per-dollar column first, every time |
| Equal ratios, unspent money | Stopping at 2 teas and 1 sandwich because both give 10 per dollar, with $6 left over | The rule has two conditions: matching per-dollar values and a fully spent budget |
| Equalising marginal utility itself | Treating the first tea and the third sandwich as equivalent because both give 24 | Compare 12 per dollar with 6 per dollar; they are not equivalent |
| Reading total utility as marginal utility | Using 44 as the value of the second cup | Take the difference: 44 minus 24 is 20 |
| A parallel shift for a price change | Moving both intercepts when only one price moved | A price change pivots the line; an income change shifts it |
A short drill makes the fixes automatic. Write your own two-good tables with different prices and budgets, and solve every one in the same order: per-dollar column, buy down, check the budget, add up total utility. If the topic comes up in a single-answer paper or a timed live round, it rewards speed as much as understanding; what each round asks is set out in our stage-by-stage guide to the CNEC rounds.
From the rule to the demand curve, and where the model runs out
Cut the sandwich price from $4 to $2 and rerun the rule with the same $14. Sandwiches now give 20, 16, 12, 8 and 4 per dollar, while tea is unchanged at 12, 10, 8, 6 and 4. Buying down the columns ends at 3 teas and 4 sandwiches, with both goods at 8 per dollar and the $14 fully spent. The quantity of sandwiches demanded rose from 2 to 4 as the price fell from $4 to $2: two points on this consumer's demand curve, derived rather than assumed.
Two forces sit inside that change. The substitution effect: sandwiches became cheaper relative to tea, so the consumer shifts towards them. The income effect: the old bundle of 3 teas and 2 sandwiches now costs only $10, so the same $14 stretches further. For a normal good both effects push quantity up. For an inferior good the income effect pushes the other way, and in theory a strong enough income effect could make quantity demanded rise with price, which is a Giffen good. Evidence is scarce. A 2008 study in the American Economic Review by Robert Jensen and Nolan Miller reported strong evidence of Giffen behaviour for rice among extremely poor households in Hunan, and weaker evidence for wheat in Gansu. On a principles paper, assume demand slopes downward unless the question deliberately builds those conditions.
Three connections turn the model into more than a calculation:
- The paradox of value. Adam Smith, whose name is on CNEC's advanced division, observed that water is essential yet cheap while diamonds have little practical use yet are dear. Marginal thinking resolves it: price reflects the value of the last unit, and the last litre of plentiful water is worth very little.
- Consumer surplus. What someone would pay for each successive unit tracks its marginal benefit, so the gap between that willingness to pay and the market price is exactly what surplus questions measure.
- Bounded rationality. Herbert Simon, namesake of CNEC's new AI division, argued that real people rarely compute every ratio; they satisfice, settling on an option that is good enough. Edexcel International GCSE students have met a version of this already: their specification lists reasons consumers may not maximise their benefit, including not always being good at calculating benefits, habits that are hard to give up and copying other people.
If you have taken AP Microeconomics, marginal analysis and consumer choice sit in the course's first unit. The 2027 CNEC outline recommends the Adam Smith division for students who have studied both microeconomics and macroeconomics in IBDP, AP or AS, so that is where this material is most likely to be assumed rather than taught; our Adam Smith division guide sets out what that track expects.
Frequently asked questions
What is the utility-maximising rule in consumer choice?
Spend the whole budget so the last unit of each good gives equal marginal utility per dollar, as closely as whole units allow.
Does diminishing marginal utility mean total utility is falling?
No. Total utility keeps rising while marginal utility is positive. It peaks when marginal utility reaches zero and falls once it turns negative.
How does a price change move a budget line?
It pivots the line around the intercept of the other good and changes its slope. An income change shifts the line in parallel instead.
Should I expect Giffen goods on a principles-level paper?
Rarely. Real evidence is scarce, so assume demand slopes downward unless a question sets up an inferior staple with a strong income effect.
Published by the NEC (CNEC) editorial desk, operated by Hanlin Education for China-based international-school students. Official rules are set by the competition and change yearly — confirm current details on councilforeconed.org and through the official CNEC channels. Errors are corrected within 7 working days.