Principles macroeconomics draws two different graphs with an interest rate on the vertical axis. The money market sets the nominal interest rate from money demand and money supply. The loanable funds market sets the real interest rate from saving and borrowing. Bond prices move opposite to interest rates in both stories. In our coaching, most lost marks on this topic come not from missing knowledge but from drawing the right idea on the wrong graph.
As with every topic, NEC publishes no topic weighting, and the Council for Economic Education describes the competition as testing core micro and macroeconomic principles alongside knowledge of the world economy. This material is standard principles macroeconomics. The CEE's EconEdLink platform teaches the two graphs side by side in an AP Macroeconomics lesson, The Money Market and the Loanable Funds Market, which identifies the loanable funds market as the place where the real interest rate is determined.
Two graphs, one axis label that fools students
| Feature | Money market | Loanable funds market |
|---|---|---|
| Vertical axis | Nominal interest rate | Real interest rate |
| Horizontal axis | Quantity of money | Quantity of loanable funds |
| Supply | Money supply, set by the central bank and drawn vertical in the simple model | Saving by households and firms, government surpluses and lending from abroad |
| Demand | Demand for money, from transactions, precautionary and asset (speculative) motives | Borrowing for business investment, household borrowing and government deficits |
| What shifts supply | Central bank policy | Saving behaviour, the government budget position, capital flows from abroad |
| What shifts demand | The price level, real output, payments technology | Expected returns on investment, household borrowing plans, government borrowing |
| Typical question | What happens to the nominal rate after a policy change or a change in money demand? | What happens to the real rate and private investment when saving or borrowing changes? |
The reliable test is not the phrase interest rate in the question. It is the actor. If the scenario is about a central bank, or about how much money people want to hold, it lives in the money market. If it is about who saves and who borrows, whether households, firms, the government or foreign savers, it lives in loanable funds. AP Macroeconomics teaching materials make the same point from the other side: EconEdLink’s own AP Macro resources alert teachers to make sure students know the difference between the two markets and use the appropriate one. NEC is a different assessment, but the distinction being tested is the same one.
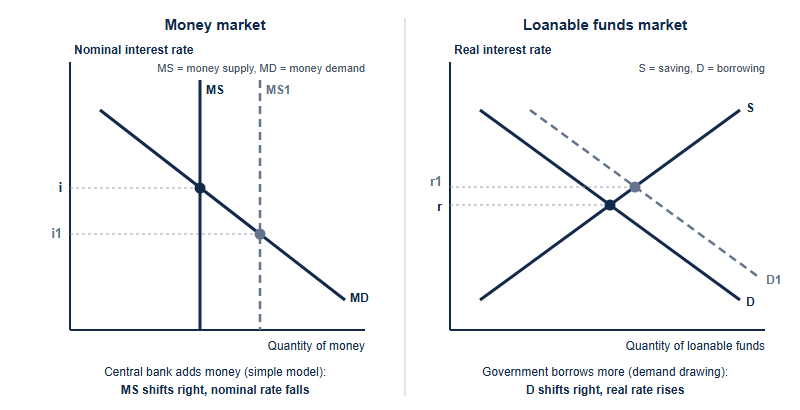
Inside the loanable funds market: who saves, who borrows, what shifts
The supply of loanable funds is saving made available to borrowers. Households and firms save out of income. Governments add to the pool when they run a surplus and draw on it when they run a deficit. Foreign savers lend into the market too, and funds tend to flow towards higher real returns. The accounting behind the supply side is worth memorising, because scenario questions are built on it:
- National saving = private saving + public saving
- Private saving = income − taxes − consumption
- Public saving = taxes − government spending, so a deficit is negative public saving
Put numbers on it. Suppose income is $1,000, taxes $200, consumption $650 and government spending $250. Private saving is 1,000 − 200 − 650 = $150. Public saving is 200 − 250 = −$50, a deficit. National saving is therefore $100, not $150: the deficit has absorbed a third of what households and firms saved. That subtraction is the arithmetic underneath every crowding-out item.
The demand side is borrowing: businesses financing capital projects, households borrowing for homes and cars, and governments borrowing to fund deficits. The demand curve slopes downward because a higher real interest rate makes every project and purchase more expensive to finance.
The real rate matters because of what it discourages. A higher real interest rate weighs on the two kinds of spending most sensitive to borrowing costs, business investment and interest-sensitive household spending. Less investment today means slower growth in the capital stock, and in the long run less productive capacity than the economy would otherwise have had.
Government deficits: two correct drawings, one certain result
Here principles materials genuinely differ, and students who have learned from two sources can talk themselves out of a correct answer. One convention treats government borrowing as extra demand for loanable funds. The other treats a deficit as negative public saving, which reduces national saving and so shrinks the supply of loanable funds. Principles-level materials treat both drawings as correct, and the real interest rate rises either way; the supply version has the advantage of showing directly how few funds are left for private borrowers.
| Convention | Curve that moves | Real interest rate | Equilibrium quantity of loanable funds | Private investment |
|---|---|---|---|---|
| Deficit as extra borrowing | Demand shifts right | Rises | Rises, with the government taking a larger share | Falls |
| Deficit as lower national saving | Supply shifts left | Rises | Falls | Falls |
The exam-craft lesson follows directly. The rise in the real interest rate and the fall in private investment are safe under either convention. The change in the total quantity of loanable funds is not, so if an answer option turns on quantity, read the question's setup for which drawing it implies before you commit. That fall in private investment is crowding out, and how far it offsets a fiscal stimulus is a fiscal-policy question in its own right.
The same discipline handles harder stems that stack two moves in one market. Suppose a government introduces a tax credit for business investment and pays for it by borrowing. Firms now want to borrow more at every rate, and the government borrows too, so both moves push the real interest rate up. The effect on private investment is genuinely ambiguous: the credit encourages it while the higher rate discourages it, and the stem gives you no sizes. The general rule: when two shifts push a variable the same way, that variable is the clean answer; when they push it opposite ways, its direction depends on sizes, and an option claiming a definite direction is a trap unless the stem supplies them.
Bond prices and interest rates: the seesaw, with numbers
A bond is a promise of fixed future payments, so its price and its yield are two views of the same deal. Take a one-year bond that pays $1,050 at maturity. Buy it for $1,000 and you earn $50, a 5 per cent return. If its market price falls to $980, the same $1,050 now represents a return of about 7.1 per cent. If the price rises to $1,020, the return falls to about 2.9 per cent. Price up, yield down; price down, yield up.
The same logic explains why existing bonds lose value when interest rates rise. The simplest case for mental arithmetic is a bond that pays $40 a year forever, whose price is the payment divided by the interest rate. At 4 per cent it is worth $1,000. If market rates rise to 5 per cent it is worth $800, and at 8 per cent only $500. Nobody pays full price for an old, fixed payment when new bonds pay more.
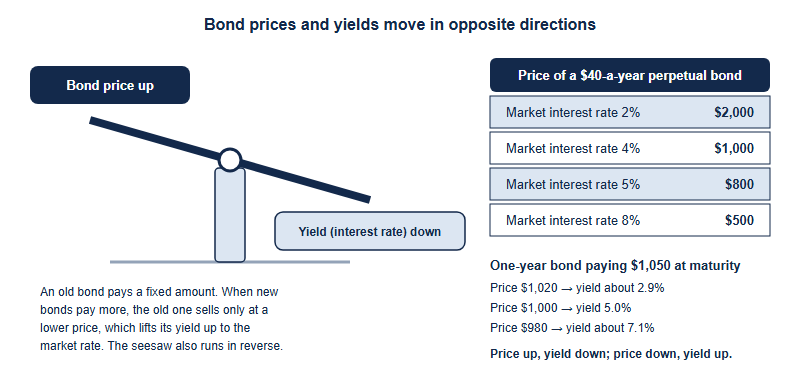
Now connect the seesaw to both graphs. In the simple textbook money market, a central bank that buys bonds pushes bond prices up and interest rates down, the same move as a rightward shift of money supply. In the loanable funds market, a government that sells more bonds to finance a deficit pushes bond prices down and interest rates up. One seesaw, two stories. Money, bonds and shares also differ as assets: money is the most liquid and earns little or nothing, bonds pay interest but can lose market value when rates rise, and shares carry more risk in exchange for a potentially higher return.
The scenario sorter: which graph does the question live in?
| Scenario | Graph | What moves | Result |
|---|---|---|---|
| Households grow anxious about the future and save more | Loanable funds | Supply shifts right | Real rate falls; private investment rises |
| The government borrows to fund a larger deficit | Loanable funds | Demand right, or supply left, by convention | Real rate rises; private investment falls |
| Firms expect higher returns and plan more capital projects | Loanable funds | Demand shifts right | Real rate rises; quantity of funds rises |
| A recession makes firms shelve borrowing plans | Loanable funds | Demand shifts left | Real rate falls; quantity of funds falls |
| Higher real returns at home attract foreign savers | Loanable funds | Supply shifts right | Real rate eases back |
| The central bank buys bonds, in the simple textbook model | Money market | Money supply shifts right | Nominal rate falls; bond prices rise |
| Prices and real output rise, so people hold more money for transactions | Money market | Money demand shifts right | Nominal rate rises |
| Market interest rates rise | Bond prices | Existing fixed payments are worth less | Prices of existing bonds fall |
One link joins the two graphs: the nominal interest rate is approximately the real interest rate plus expected inflation. If lenders expect inflation to rise by two percentage points and still want the same real return, nominal rates rise by about two points. That is why a question about expected inflation can move a nominal rate without any change in saving or borrowing.
From coaching this topic, the fix that works best is verbal before visual. Before drawing anything, say aloud whether the question is about a real or a nominal rate, then name the actor, then draw. Eight mixed scenarios a session, shuffled across both markets and the bond seesaw, turn that routine into a habit. Items like these reward fast, precise classification, the habit a single-answer paper and a timed live round both demand; what each CNEC round asks is set out in our stage-by-stage guide to the CNEC rounds. The 2027 CNEC outline recommends the Adam Smith division for students who have studied both microeconomics and macroeconomics in IBDP, AP or AS, which is where the financial sector is most likely to be treated as assumed knowledge; our Adam Smith division guide covers what that track expects.
Frequently asked questions
What is the difference between the money market and the loanable funds market?
The money market sets the nominal interest rate from money supply and demand. The loanable funds market sets the real rate from saving and borrowing.
Why do bond prices fall when interest rates rise?
An existing bond pays a fixed amount. When new bonds pay more, the old one only sells at a lower price, which lifts its yield to the market rate.
Does a government deficit shift demand or supply of loanable funds?
Materials draw it either way: more demand, or less national saving. Both show a higher real interest rate and lower private investment.
Which interest rate goes on the loanable funds graph?
The real interest rate, because savers and borrowers care about returns after inflation. The money market graph uses the nominal rate.
Published by the NEC (CNEC) editorial desk, operated by Hanlin Education for China-based international-school students. Official rules are set by the competition and change yearly — confirm current details on councilforeconed.org and through the official CNEC channels. Errors are corrected within 7 working days.