
In the timed rounds of the National Economics Challenge (NEC), a diagram is a tool, not a decoration. The students who score well can sketch a clean supply-and-demand or AD-AS graph in seconds, label its axes without thinking, shift the right curve in the right direction, and read an unfamiliar graph fast enough to answer before the clock runs out. This guide treats that visual fluency as a trainable skill — what to draw, how to draw it under pressure, and how to read graphs quickly.
Why diagram fluency is a separate skill worth training
Knowing the economics and being fluent with its diagrams are two different abilities, and the NEC's format rewards the second one specifically. The competition is built around seven timed rounds — the Qualifying Test, Super Econ, Quiz Bowl, Critical Thinking, Econ Lab, Econ Immersion and U20 Youth Voice — covering microeconomics, macroeconomics, and the world / international economy. Across that range, the same handful of graphs reappears, and the binding constraint is rarely whether a student understands the model. It is whether they can produce or interpret the relevant diagram fast enough, under pressure, without second-guessing the axes.
That is good news for prep, because a skill you can name is a skill you can drill. A student who has internalised the visual grammar — price on the vertical axis, quantity on the horizontal, demand sloping down, supply sloping up — spends their scarce seconds reasoning about the shift, not reconstructing the frame. The academic standard the diagrams are tested against is set by the Council for Economic Education (CEE, founded 1949), which runs the NEC in the United States, where it reaches roughly 10,000 students a year. From China, the route into that standard is CNEC, the official China National Round operated by Hanlin (SKT) since 2016 across 20+ provinces and 300+ schools, and the only official path to the NEC global rounds. As you build a study plan, confirm the current round line-up and timings on the official CNEC pages, since formats can vary by division and season.
The must-know diagrams: a core toolkit
You do not need an unlimited library of graphs. You need a small core you can draw cold, plus the confidence to recognise variations of them. Because the NEC content spans micro, macro and the international economy, the toolkit naturally falls into those three families. The table below is a starting checklist of the diagram types worth being able to produce or read at speed — treat it as a prep map, not an official syllabus, and let your division's materials and the CNEC channels set the final scope.
| Family | Diagrams to be fluent with | Axes you must never hesitate on |
|---|---|---|
| Microeconomics | Supply & demand; shifts vs. movements; elasticity (steep vs. flat); price ceilings / floors; basic surplus areas | Price (vertical) × Quantity (horizontal) |
| Macroeconomics | AD-AS; the production possibilities frontier (PPF); a simple money-market or loanable-funds sketch | Price level / interest rate (vertical) × Real output or quantity (horizontal) |
| World / international economy | Trade with a world price line; gains-from-trade; a tariff's effect on a single market | Price (vertical) × Quantity (horizontal), with a horizontal world-price line |
The pattern to notice is that almost every micro and trade diagram shares one frame: price up the side, quantity along the bottom. If that frame is automatic, three-quarters of the toolkit is already drawn before you touch a single curve. The macro graphs swap the axis labels — price level and real output for AD-AS, interest rate and quantity of money or funds for the money side — but the discipline is identical: lock the axes first, then add the lines.
Drawing fast and accurately under pressure
Speed in a diagram comes from a fixed sequence, not from rushing. Under time pressure the temptation is to draw curves first and label afterwards — which is exactly how students end up with an unlabelled mess or a demand curve sloping the wrong way. A reliable five-step routine fixes the order of operations so the hand can move quickly while the brain stays on the economics.
The routine below is the same whether you are sketching on scratch paper to reason through a Quiz Bowl question or producing a clean graph in a written round. Practise it until it is muscle memory: the goal is that drawing the empty, correctly-labelled frame takes you no conscious effort at all, leaving your thinking time for the part that actually earns marks — the shift and its consequence.
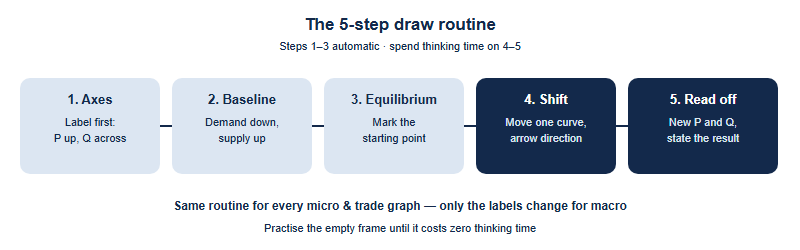
Three habits separate a fast, accurate diagram from a slow, error-prone one. First, label the axes before anything else — an unlabelled graph is ambiguous and a wrongly-labelled one is wrong. Second, shift, do not redraw: when a question changes one variable, move only the affected curve and keep the original line visible so the before-and-after comparison is obvious. Third, commit to the direction with an arrow; a faint, hedged curve that could be read either way wastes the very clarity a diagram exists to provide. None of these is about drawing talent. They are procedural habits that survive the adrenaline of a timed round.
Reading graphs quickly in timed rounds
Half of diagram skill is interpretation: a graph appears on screen or on the page, and you have seconds to extract what it is saying. Reading fast is, again, a fixed routine rather than a talent. The trap is jumping straight to the curves and guessing the story; the cure is a short, ordered scan that loads the frame before the detail, so your interpretation is anchored to what the axes actually measure.
A practical read-order is: axes first — what is being measured, and in what units? — then the curves and their slopes, then any shift or shaded region, and only then the question being asked. This sounds slower than diving in, but it is faster in practice, because it prevents the costly mistake of answering a confidently-misread graph. The mini-routine below is worth rehearsing on past-style questions until it runs automatically.
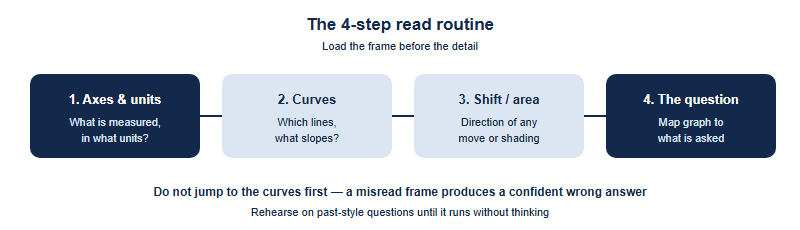
A few reading reflexes pay off repeatedly. Always check whether a line has moved or merely been pointed at along itself — the difference between a shift and a movement along a curve is one of the most common things tested, and the most common thing misread. Watch the units and scale on the axes before comparing magnitudes. And when a region is shaded, ask what it represents before assuming — the same triangle can be a gain or a loss depending on the frame. These reflexes are exactly what separate a student who merely "knows the model" from one who can use it at speed.
A first-party way to train this
From years of running the China National Round, the single most useful drill we point students toward is deceptively small: the blank-frame sprint. Set a timer, and from memory draw the empty, fully-labelled frame for each core diagram — axes, default curves, equilibrium — with no shift and no story attached. Most students discover that the part they thought was "easy" is exactly where their seconds leak: a hesitation over which axis is price, a supply curve that drifts the wrong way. Drilling the empty frame to zero-hesitation frees up the thinking time that the actual question deserves.
Layer the second drill on top: the one-shift challenge. Take a single core diagram and run it through a list of one-line shocks — "input costs rise," "a subsidy is introduced," "world price falls" — drawing only the affected curve each time and reading off the new equilibrium out loud. This rehearses steps four and five of the draw routine in isolation, which is where marks are actually won. Build these into a wider study plan rather than treating diagrams as an afterthought; our overview of how to structure NEC preparation sits on the CNEC preparation pages, and the round-by-round picture is in our guide to the seven NEC rounds. As ever, treat any specific scoring weight or format detail as organiser-defined and confirm it on the official CNEC channels.
Frequently asked questions
Which diagrams should I prioritise for the NEC?
Start with the price-quantity frame shared by supply-demand, elasticity and basic trade graphs, then add AD-AS and the PPF. Confirm scope on the CNEC channels.
Is drawing graphs even tested, or is the NEC multiple choice?
The NEC's rounds and formats are organiser-defined and can vary by division and season; diagram reading appears widely. Confirm the current format officially.
How do I avoid drawing a curve the wrong way under pressure?
Use a fixed order: label axes first, draw baseline curves, mark equilibrium, then shift only the affected curve with a direction arrow.
What is the fastest way to read an unfamiliar graph?
Read the axes and units first, then the curves and slopes, then any shift or shaded area, and only then the question itself.
Published by the NEC / CNEC editorial desk, operated by Hanlin Education as the officially authorized China National Economics Challenge (CNEC) test center. The NEC is run by the Council for Economic Education, which sets the official rules — always confirm current dates, divisions, fees and awards on the official CNEC channels. Any errors will be corrected within 7 working days.