
The National Economics Challenge (NEC) tests consumer and producer surplus, and deadweight loss, as a geometry problem hiding inside an economics question. A welfare item hands you a supply-and-demand diagram and asks you to read off areas: the triangle above the price for consumers, the triangle below for producers, and the lost triangle a tax or price control carves out. Score these fast and you free up time for the harder rounds. This guide maps the shapes.
What surplus actually measures — before any tax
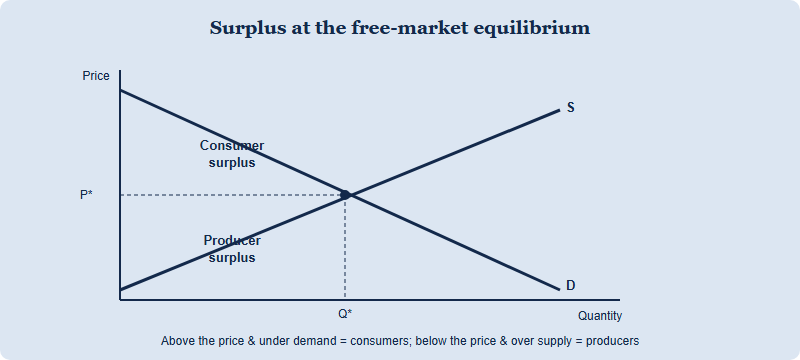
Welfare analysis starts at the free-market equilibrium, where the demand and supply curves cross. Consumer surplus is the gap between what buyers were willing to pay and what they actually paid — the area under the demand curve and above the equilibrium price. Producer surplus is the mirror image: the area above the supply curve and below the equilibrium price, capturing the difference between the price sellers receive and the minimum they would have accepted.
Add the two together and you get total surplus, the standard NEC measure of how much value a market creates. At the competitive equilibrium this combined area is at its maximum — the result behind the phrase "markets are efficient." That single fact is the anchor for almost every welfare question: any intervention that moves the market away from equilibrium shrinks total surplus, and the size of that shrinkage is the deadweight loss you will be asked to find. You can see how microeconomics sits inside the wider exam on the CNEC site.
Two reading habits prevent most errors. First, consumer surplus is always the region under demand; producer surplus is always the region over supply. Second, every one of these regions is a triangle (or, after a tax, a trapezoid you can split into a rectangle and a triangle), so the only formula you genuinely need is one-half times base times height.
| Welfare area | Where it sits on the diagram | What it represents |
|---|---|---|
| Consumer surplus | Under the demand curve, above the price | Value buyers gain beyond what they pay |
| Producer surplus | Above the supply curve, below the price | Value sellers gain beyond their minimum acceptable price |
| Total surplus | Consumer surplus + producer surplus | Total value the market creates; maximised at equilibrium |
| Deadweight loss | The triangle between supply and demand over the lost units | Value destroyed when output moves away from equilibrium |
Reading surplus areas off a diagram fast
NEC's timed rounds reward students who turn a picture into a number without hesitating. The reliable method is to treat consumer surplus and producer surplus as right triangles and apply one formula: area = ½ × base × height. For consumer surplus, the base is the equilibrium quantity and the height is the vertical distance from the equilibrium price up to the demand curve's price-axis intercept. For producer surplus, the base is again the equilibrium quantity and the height runs from the supply curve's intercept up to the equilibrium price.
A worked illustration shows how quick this is. Suppose demand hits the price axis at $20, supply starts at $4, and the equilibrium is 8 units at a price of $12. Consumer surplus is ½ × 8 × ($20 − $12) = $32. Producer surplus is ½ × 8 × ($12 − $4) = $32. Total surplus is $64. The figures here are illustrative, chosen to show the procedure rather than any official exam value — but the steps transfer to whatever numbers a question supplies.
Three habits separate full marks from near-misses on these items:
- Always identify the intercepts first. The price-axis intercepts of demand and supply are the heights of your triangles; misreading them is the most common slip.
- Keep base and height perpendicular. The base sits along the quantity axis, the height along the price axis — never mix a sloped distance into the calculation.
- State units. Surplus is measured in currency (dollar value of welfare), not in units of output; a number with no unit invites a deduction in written rounds.
Deadweight loss from a tax
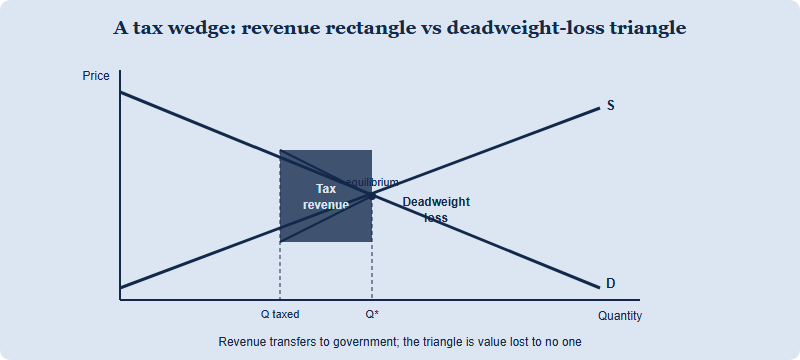
The moment a per-unit tax appears, the welfare picture splits. The tax drives a wedge between the price buyers pay and the price sellers keep, so the quantity traded falls below the efficient level. Consumer surplus shrinks, producer surplus shrinks, and part of what they lose becomes government tax revenue — the rectangle whose height is the tax per unit and whose width is the new, smaller quantity. But not all of the lost surplus is recovered as revenue. The remainder is the deadweight loss: a triangle that represents mutually beneficial trades that no longer happen.
That triangle is the heart of every tax-welfare question. Its height is the size of the tax wedge (the vertical gap between demand and supply at the reduced quantity), and its base is the drop in quantity from the efficient level to the post-tax level. Apply the same formula: deadweight loss = ½ × (fall in quantity) × (tax per unit). A larger tax, or more elastic curves, produces a bigger triangle — which is exactly the intuition the NEC wants you to be able to explain, not just compute.
A frequent trap is double-counting. Tax revenue and deadweight loss are separate areas: revenue is the rectangle that transfers from buyers and sellers to the government, while deadweight loss is the triangle that vanishes entirely. Adding them or confusing one for the other is a classic way to lose an otherwise-correct answer.
Price controls: ceilings, floors and the same lost triangle
Price ceilings and price floors create deadweight loss through a different mechanism but the same geometry. A binding price ceiling — a legal maximum set below equilibrium, such as rent control — pushes quantity supplied down, producing a shortage. A binding price floor — a legal minimum set above equilibrium, such as a minimum wage in a labour-market diagram — pushes quantity demanded down, producing a surplus. In both cases the quantity actually traded falls below the efficient level, and the welfare triangle between supply and demand over those missing units is once again deadweight loss.
The procedure NEC rewards is identical to the tax case: find the new traded quantity (the short side of the market), measure the vertical gap between demand and supply at that quantity, and compute ½ × base × height. What differs is the distribution story — a ceiling tends to shift surplus toward consumers who can still buy, while a floor can shift it toward sellers who can still sell — and strong written answers name who gains and who loses, not just the size of the loss.
A reliable check across all three interventions: deadweight loss exists whenever the quantity traded differs from the competitive quantity, and it is always the triangle bounded by the demand curve above and the supply curve below, spanning the units that no longer change hands. Internalise that one sentence and ceilings, floors and taxes stop being three separate topics. For where these micro skills sit in the team rounds, see the round structure on the CNEC site.
A first-party note on building the welfare instinct
As the officially authorized China test center running the China National Economics Challenge (CNEC), the editorial desk sees the same pattern in mock rounds each cycle: students who can recite the surplus definitions still freeze when a diagram replaces words. The fix is not more theory but repetition on the geometry — drawing the triangles by hand, labelling base and height, and forcing yourself to attach a currency value. Because the NEC's timed format (per the organiser, scoring and round details should be confirmed on the official CNEC channels) leaves little room to rederive ideas under pressure, the habit of "see diagram, mark intercepts, compute ½ × base × height" is worth more than any single memorised fact. Treat welfare analysis as a drawing skill, and the marks follow.
Frequently asked questions
Is consumer surplus the area above or below the demand curve?
Below the demand curve and above the market price. It captures the value buyers receive beyond what they actually pay for the good.
How do I calculate deadweight loss from a tax?
Use ½ × (fall in quantity) × (tax per unit). It is the triangle between supply and demand over the units no longer traded.
Do price ceilings and price floors both cause deadweight loss?
Yes, when binding. Each pushes the traded quantity below equilibrium, creating the same welfare-loss triangle between supply and demand.
Is tax revenue part of the deadweight loss?
No. Tax revenue is a separate rectangle that transfers to the government; deadweight loss is the triangle of value that disappears for everyone.
Published by the NEC / CNEC editorial desk, operated by Hanlin Education as the officially authorized China National Economics Challenge (CNEC) test center. The NEC is run by the Council for Economic Education, which sets the official rules — always confirm current dates, divisions, fees and awards on the official CNEC channels. Any factual error will be corrected within 7 working days.