
In the National Economics Challenge (NEC), the harder elasticity questions never ask you to compute a coefficient — they hand you a market scenario and ask what happens. A subsidy, a sin tax, a bumper harvest: each plays out differently depending on how elastic demand and supply are. This guide is about applying price elasticity of demand (PED) and price elasticity of supply (PES) to those scenarios — predicting revenue, splitting a tax burden, and reasoning to a conclusion rather than to a number.
Application, not calculation: what the scenario questions reward
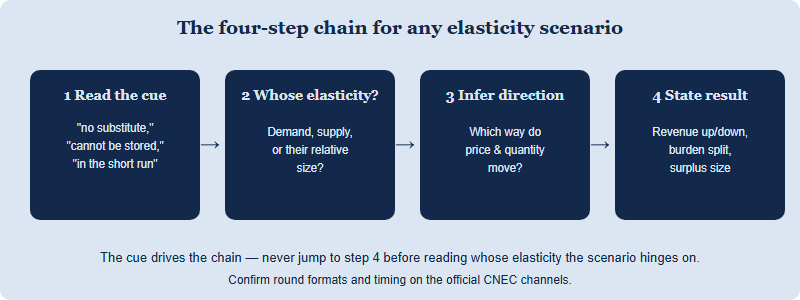
A separate skill sits on top of computing elasticity. Knowing that PED equals the percentage change in quantity demanded over the percentage change in price tells you how to label a market; it does not, on its own, tell you who wins when a government taxes that market, or why a record crop can leave farmers poorer. The NEC draws its content from microeconomics, macroeconomics and the world economy, and within micro the application items reward a chain of reasoning: identify whose elasticity matters, infer the direction of the effect, then state the consequence.
The trap in these questions is reaching for a formula when the stem gives you no numbers to plug in. Often it gives you a description — “demand for insulin is highly inelastic,” “the crop cannot be stored, so supply is fixed this season” — and expects you to convert that description into a prediction. The CEE, founded in 1949, sets the academic standard these items are written against; you can see where micro sits among the seven rounds on the CNEC site. The sections below take the three scenario families NEC most often builds: revenue, taxes, and supply shocks.
| Scenario type | Whose elasticity decides it | What you are asked to predict |
|---|---|---|
| Price change by a firm or cartel | PED of the good | Direction of total revenue |
| A tax or subsidy on a good | PED relative to PES | Who bears more of the burden / benefit |
| Supply shock (harvest, disruption) | PED, with supply shifting | What happens to producer revenue |
| Minimum price / price floor | PES and PED together | Size of the resulting surplus |
Scenario one: predicting revenue when the stem gives no numbers
The revenue link is the most familiar application, but the scenario version is harder than the calculation version because nothing is quantified. You are told a firm is considering a price rise and given a reason demand is elastic or inelastic — many substitutes, a large share of income, a long time horizon — and asked which way revenue moves.
The reasoning is one step: an elastic good loses so much quantity when price rises that revenue falls, so the firm should cut price; an inelastic good loses little quantity, so revenue rises with price. What makes it a scenario question is that you must first infer the elasticity from the description before you apply the rule. A good with “many close competitors” is elastic; a good that is “a small, habitual purchase” or “has no substitute” is inelastic.
- Necessities with no substitute (a life-saving medicine) are inelastic — a producer can raise price and gain revenue, which is exactly why these markets attract regulation.
- Goods with many rivals (one brand of bottled water among dozens) are elastic — raising price drives buyers away and cuts revenue.
- Luxuries and big-ticket items tend to be elastic because the purchase can be delayed, so discounting can lift total revenue.
The first-party tip we give CNEC teams: in a scenario item, underline the phrase that signals elasticity before you decide the revenue direction. The question is testing whether you can read “highly addictive, no close substitute” as “inelastic” and only then conclude “a tax raises a lot of revenue and barely cuts consumption.” Skip the inference and you will answer a different question than the one asked.
Scenario two: who really pays the tax (incidence)
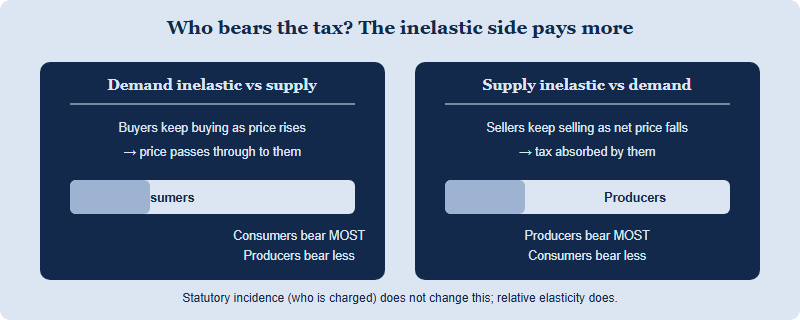
Tax incidence is where NEC scenario questions punish the gap between calculation and application most sharply, because the answer is almost always counter-intuitive. A government may levy a tax on sellers, but who economically bears it — whose pocket actually shrinks — is decided by the relative elasticities of demand and supply, not by who writes the cheque.
The principle: the more inelastic side of the market bears the larger share of the tax. If demand is inelastic relative to supply, consumers carry most of the burden, because they keep buying even as the price climbs. If supply is inelastic relative to demand, producers carry most of it, because they keep selling even as the after-tax price they receive falls. The statutory label — “a tax on producers” versus “a tax on consumers” — does not change this split. That distinction between statutory incidence (who is legally charged) and economic incidence (who really pays) is the single idea these questions are built to test.
This is why governments tax cigarettes, alcohol and fuel to raise money: demand is inelastic, so consumers bear most of the burden and quantity falls only a little, which is good for revenue but a weak deterrent. It is also why a tax on a good with many substitutes raises little — buyers simply switch, supply and demand both adjust, and the quantity collapses. A well-built NEC item rewards you for naming the relative elasticities and then assigning the burden, in that order.
| Market in the scenario | Relative elasticity | Who bears more of the tax |
|---|---|---|
| Cigarettes (addictive, few substitutes) | Demand far more inelastic than supply | Consumers |
| A specific brand among many rivals | Demand elastic | Producers absorb more, or quantity collapses |
| Perishable crop that cannot be stored | Supply inelastic this season | Producers |
| Highly responsive manufactured good | Supply elastic, demand inelastic | Consumers |
Scenario three: applied PES and the supply shock
PES — how much quantity supplied responds to price — is tested mostly through what it implies about time and storability. The classic NEC scenario is the agricultural supply shock: a bumper harvest of a perishable crop. Supply is inelastic in the short run (the crop is already grown and cannot be stored), and demand for a staple food is inelastic too. Push a large quantity into an inelastic-demand market and price collapses by a larger percentage than quantity rose — so producer revenue falls. The “paradox” that a great harvest makes farmers worse off is pure applied elasticity, and the question is testing whether you can reason it through rather than assume more output means more income.
The determinants of PES are the toolkit for these items. They tell you whether supply can respond, and therefore how a market absorbs a shock or a policy:
- Time horizon. Supply is more elastic the longer the period — firms can build capacity, plant more, or retrain. A scenario set “in the short run” is signalling inelastic supply.
- Spare capacity and stocks. A producer sitting on idle factories or warehouses can expand quickly — elastic supply. One at full capacity, or with a perishable good, cannot — inelastic.
- Factor mobility. If labour and materials shift easily into the industry, supply responds; if they are specialised, it does not.
Read these as cues, not formulas. When a stem stresses “cannot be stored,” “already harvested,” or “in the short term,” it is telling you supply is inelastic — and that single fact often determines the whole answer about price, revenue, or who absorbs a tax.
Drilling the application step for the NEC rounds
Application errors are different from calculation errors, so they need their own practice. A student can compute elasticity flawlessly and still pick the wrong revenue direction or the wrong tax-bearer because they skipped the inference step. Within the China National Round, run by Hanlin (SKT) since 2016 across 20+ provinces and 300+ schools, these are the routines we use to build the scenario reflex:
- Turn descriptions into labels first. Take a stem, ignore the question, and write only “demand inelastic, supply elastic.” Decide the elasticities before you let yourself answer anything.
- Always name the incidence rule aloud. For any tax scenario, say “the more inelastic side pays more” and then assign the burden. Naming the rule stops you defaulting to “whoever is taxed pays.”
- Practise the counter-intuitive cases. The bumper-harvest paradox and the addictive-good tax are NEC favourites precisely because intuition gets them wrong. Rehearse them until the elasticity logic overrides the gut answer.
- Separate statutory from economic incidence on paper. Write two columns — “who is charged” and “who really pays” — and fill both. The whole point of these items is that the columns differ.
Elasticity application threads through the micro half of the NEC alongside the macro and world-economy content, so the scenario discipline you build here transfers to policy questions across the rounds. For where micro sits in the overall structure and how China teams qualify into the global rounds, start from the CNEC home page and confirm the current format, divisions and timeline on the official CNEC channels before relying on any specific detail.
FAQ
How is applying elasticity different from calculating it in the NEC?
Calculation gives a coefficient from numbers; application uses a described market to predict revenue, a tax split, or a price effect.
Who bears a tax when demand is inelastic?
Consumers bear most of it. The more inelastic side of the market — here, buyers — absorbs the larger share, regardless of who is legally charged.
Why can a bumper harvest reduce farmers’ revenue?
Supply rises into inelastic demand, so price falls by more than quantity rose, and total producer revenue drops — an applied-elasticity result.
What is the difference between statutory and economic incidence?
Statutory incidence is who is legally charged; economic incidence is who actually pays, which relative elasticity decides.
Published by the NEC / CNEC editorial desk, operated by Hanlin Education as the officially authorized China National Economics Challenge (CNEC) test center. The NEC is run by the Council for Economic Education, which sets the official rules — always confirm current dates, divisions, fees and awards on the official CNEC channels. Any factual error will be corrected within 7 working days.