When preparing for the NEC Critical Thinking (CT) round, teams often gather solid data but then weaken their presentation by pushing conclusions beyond what that data can support. The difference between advancing to global rounds and stalling at nationals frequently comes down to this single skill: knowing where your evidence ends and your speculation begins. This article provides a concrete framework for calibrating conclusion strength in your NEC case presentation, with worked teaching illustrations and a diagnostic you can apply immediately.
What the CT Round Actually Tests
The NEC Critical Thinking round presents teams with an open-ended economic scenario and requires a structured analysis with policy or business recommendations. Judges evaluate your ability to apply economic reasoning, not to produce dramatic predictions. According to the 2027 CNEC structure, CT appears at multiple stages and carries significant weight in advancement. The round rewards teams that state precisely what their evidence proves and resist the temptation to claim more.
A strong conclusion stays within the logical scope of the data and acknowledges relevant limitations. An overstated claim generalizes beyond the case parameters, ignores confounding variables, or treats correlation as established causation. Understanding this distinction is essential because CT scoring rubrics explicitly penalize unsupported assertions, even when the underlying economics is directionally correct.
Worked Teaching Illustration: The Solar Subsidy Case
Teaching illustration—hypothetical scenario for analytical practice.
Suppose your team analyzes a government subsidy to local solar panel manufacturers. Your dataset shows: production increased from 100,000 to 110,000 units (10% increase); sector employment rose from 2,000 to 2,100 workers (5% increase); and average production cost per unit fell from $200 to $190.
Step 1: Calculate verified relationships
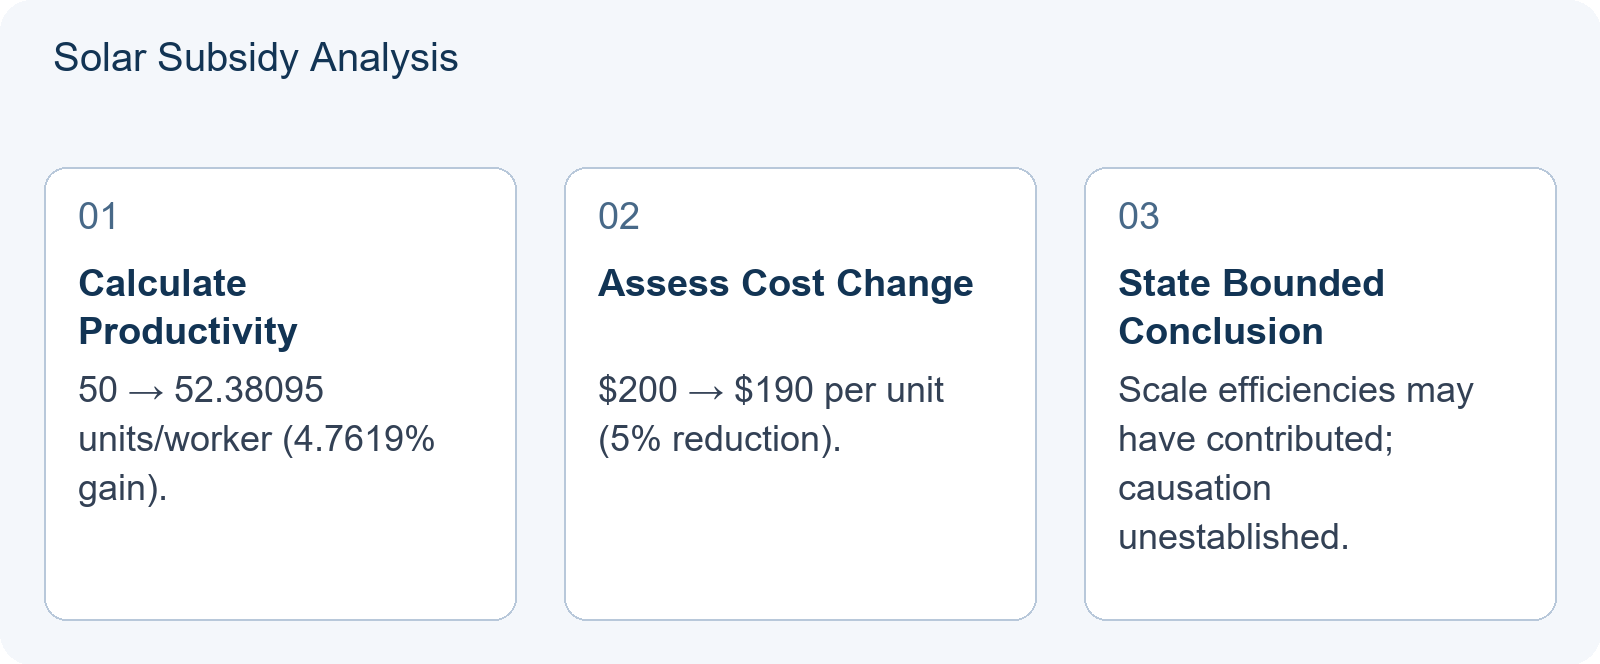
Labor productivity before subsidy: 100,000 units ÷ 2,000 workers = 50 units per worker.
Labor productivity after subsidy: 110,000 units ÷ 2,100 workers ≈ 52.38095 units per worker.
Productivity change: (52.38095 − 50) ÷ 50 × 100% ≈ 4.7619% increase.
Cost reduction: ($200 − $190) ÷ $200 × 100% = 5%.
Step 2: Draft a strong conclusion
“The subsidy coincided with a 10% production increase, a 5% employment increase, and a 5% unit cost reduction. Labor productivity rose approximately 4.76%. This before-after observational data is consistent with multiple explanations, including scale efficiencies or other industry trends, but cannot establish that the subsidy caused these changes or identify which mechanism, if any, dominated.”
Step 3: Identify the overstated version
“The subsidy proves government intervention always creates manufacturing jobs more efficiently than market allocation, and the cost reductions will permanently make domestic solar competitive without further support.”
Why the second version fails: It generalizes to “always” and “permanently,” assumes the cost reduction is sustainable rather than one-time, and ignores that the 5% employment gain may include workers who would have been hired anyway due to industry growth trends. The strong conclusion specifies the observed timeframe, notes consistency with scale efficiencies as a possible contributing factor, and explicitly states that causation cannot be established from this data alone.
Contrasting Case: Interest Rates and Inflation
Teaching illustration—hypothetical scenario for analytical practice.
Consider a macroeconomic scenario where the central bank raised interest rates by 0.5 percentage points (from 4.0% to 4.5%), and inflation fell from 4.0% to 3.5% over six months. A team might conclude: “Higher interest rates caused the inflation decline.”
This is a classic overstatement. The data shows temporal sequence, not proven causation. A stronger conclusion would be: “The rate increase coincided with declining inflation, consistent with monetary transmission mechanisms. However, without controlling for simultaneous supply-chain improvements or energy price changes, we cannot establish the rate hike as the sole or primary driver.”
In NEC CT scoring, this qualification earns more credit than the unqualified causal claim. The NEC Economic News Analysis: Separating a Data Release From a Policy Explanation article develops similar reasoning discipline for separating data releases from policy explanations—precisely the skill needed to avoid overstating what interest rate data proves.
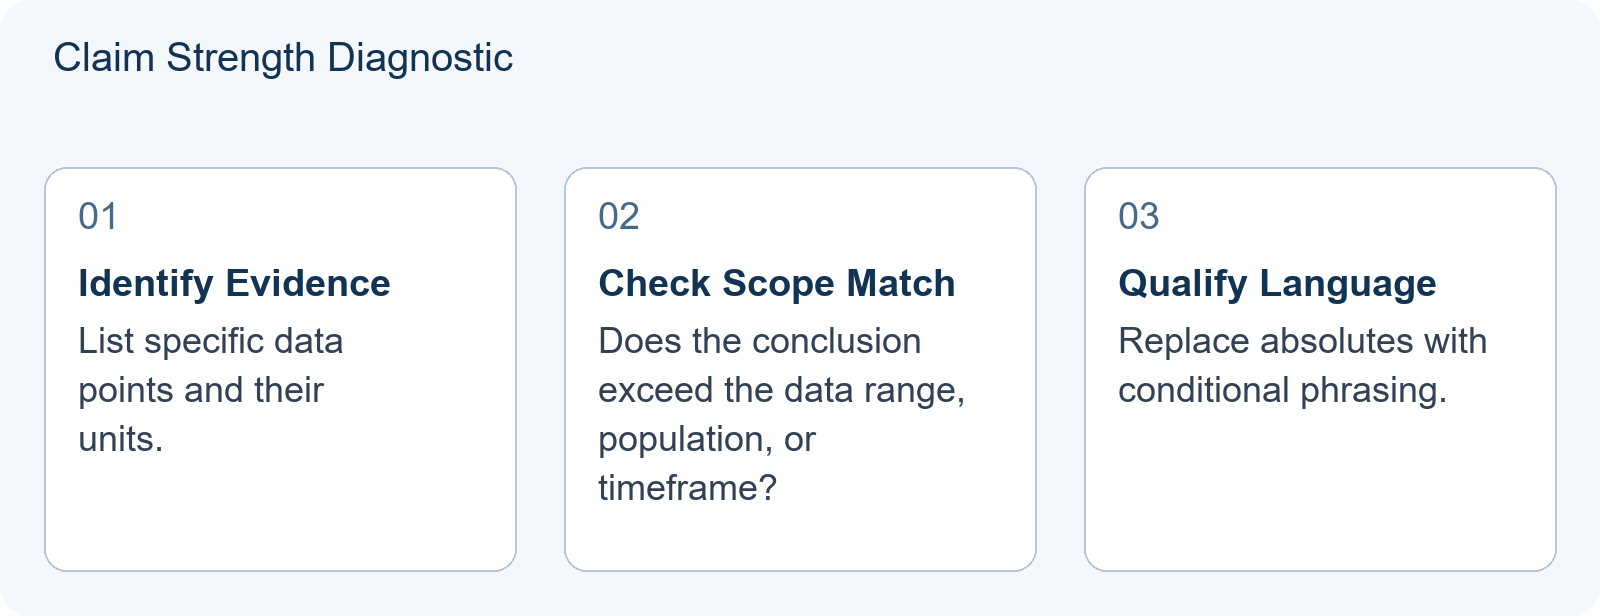
Three-Step Diagnostic for Your Presentation
Apply this framework to every major claim before finalizing your slides:
Step 1: Scope Match
Does your conclusion apply only to the population, timeframe, and geographic region studied? Replace “consumers prefer” with “the surveyed consumers preferred” when your sample is limited. Check that your recommendation addresses the specific market structure described in the case.
Step 2: Causality Verification
Have you ruled out reverse causality and third-variable explanations? If your case shows marketing spend and sales both increasing, determine whether marketing drove sales, seasonal demand drove both, or a competitor’s exit caused the sales increase that enabled higher marketing budgets.
Step 3: Magnitude Assessment
Is the effect size economically meaningful? A statistically significant 0.3% improvement in efficiency may not justify a capital investment without knowing the baseline costs, investment period, and output prices. Verify that your policy recommendation’s benefits exceed its costs at the scale observed, with complete information.
This diagnostic directly supports the skills needed for the Critical Thinking Runs Twice, and the Two Rounds Are Not the Same Test, where teams must defend their analysis under questioning. Teams that have pre-screened their claims using these three steps handle follow-up questions with specific references rather than retreating into generalities.
What Strong Conclusions Enable
Calibrated conclusions strengthen your presentation in three ways. First, they demonstrate command of economic methodology—showing you understand that models simplify reality and that real-world data requires careful interpretation. Second, they create defensible positions during the CT defense, where judges probe the boundaries of your analysis. Third, they distinguish your team from competitors who mistake boldness for insight.
The discipline of scope-matching also improves your work in other NEC rounds. In the NEC Opportunity Cost: Distinguishing Sunk Costs From the Next Best Alternative analysis, recognizing that a cost is sunk rather than incremental requires the same precision as distinguishing strong from overstated claims. Both skills depend on attending to what the evidence actually establishes.
Practical Application: Self-Test Before Submission
Before submitting your CT presentation, review each conclusion with these questions:
- Can I point to a specific data point for every clause in this sentence?
- Have I used any absolute terms (always, never, proves, guarantees) that my evidence cannot support?
- Would my conclusion remain valid if an alternative explanation for the same outcome were true?
If you answer no to the first two or yes to the third, revise. Replace absolutes with qualified language: “suggests” rather than “proves,” “contributes to” rather than “causes,” “in this case” rather than “universally.”
Conclusion
Distinguishing a strong conclusion from an overstated claim is a learnable skill that separates advancing teams from those eliminated at the margins. By matching your claims to your evidence, verifying causality, and assessing economic magnitude, you produce CT presentations that demonstrate genuine analytical maturity. This precision is what NEC judges reward and what prepares you effectively for the rigor of economics at the university level.
Applying the Diagnostic to a New Scenario
Teaching illustration—hypothetical scenario for analytical practice.
To solidify your understanding, let us apply the three-step diagnostic to a different common NEC case type: labor market intervention. Suppose a city implements a minimum wage increase from $10.00 to $11.50 per hour. Your team’s data shows that in the affected sector, employment fell from 400 workers to 380 workers over one quarter, while average hourly wages rose by 15%.
Step 1: Scope Match
Does your conclusion apply only to this specific sector and timeframe? A strong statement would be: “In the local retail sector during Q1, the wage floor coincided with a 5% reduction in headcount.” An overstated claim might say: “Minimum wages always reduce employment,” which ignores other sectors or long-term adjustments not captured in this single-quarter snapshot.
Step 2: Causality Verification
Did the wage hike cause the job loss? The data shows correlation. However, you must check for confounding variables. Did a major competitor close nearby stores during the same period? Did seasonal demand drop due to weather? Without controlling for these factors, claiming direct causation is an overstatement. A calibrated conclusion acknowledges: “The observed employment decline is consistent with standard labor demand theory, though external shocks cannot be ruled out without further data.”
Step 3: Magnitude Assessment
Is the effect economically significant? A 5% drop in employment (20 jobs) may seem small, but if the baseline was already fragile, it could represent a critical threshold for business viability. Conversely, if the firm had planned layoffs anyway, the wage change might have been incidental. You must verify whether the magnitude of the change justifies the policy recommendation’s costs relative to its benefits.
Practice Task: Rewrite the Overstated Claim
Consider this draft conclusion from a hypothetical student team analyzing the same minimum wage case:
“The data proves that raising the minimum wage destroys jobs. Therefore, we recommend abolishing all wage floors to maximize employment efficiency.”
This fails on multiple levels. It uses absolute language (“proves,” “destroys,” “all”) unsupported by a single-sector observational study. It assumes a universal negative relationship between wages and employment, ignoring potential offsetting effects like increased consumer spending by higher-wage workers. It also recommends a broad policy change based on narrow evidence.
Your task: Rewrite this conclusion using the diagnostic framework. Ensure you:
- Limit the scope to the specific sector and timeframe studied.
- Replace causal assertions with correlational language (e.g., “coincided with,” “consistent with”).
- Acknowledge limitations, such as the lack of control for external economic shocks.
- Propose a nuanced recommendation rather than an extreme binary choice.
A revised version might read: “Within the sampled retail sector, the wage increase coincided with a modest decline in employment. While this aligns with theoretical predictions of reduced labor demand, the observational nature of the data prevents definitive causal attribution. We recommend further analysis of regional economic conditions before considering broader policy adjustments.”
Why This Discipline Matters for Defense
In the NEC Critical Thinking defense round, judges often probe the boundaries of your analysis. If you have pre-screened your claims using this diagnostic, you can respond to challenges with precision. For example, if asked, “But didn’t the wage hike cause the job losses?”, you can reply, “Our data shows a temporal association, but we cannot rule out confounding variables like seasonal demand shifts. We are presenting the most plausible interpretation given the available evidence, not a proven causal mechanism.”
This response demonstrates methodological rigor. It shows you understand the difference between what the data supports and what you wish to believe. Teams that master this distinction avoid the trap of appearing dogmatic or naive. They earn credit for intellectual honesty, even when their conclusions are less dramatic. Remember, in economics, precision is more persuasive than boldness. By consistently applying the scope-match, causality-verification, and magnitude-assessment steps, you transform your presentation from a collection of assertions into a defensible analytical argument.
Frequently Asked Questions
Is it better to make a bold claim or a cautious one in NEC Critical Thinking?
Judges reward claims that are fully supported by evidence. A cautious claim with explicit boundaries demonstrates deeper understanding than a bold claim that cannot be defended. The scoring rubric values analytical rigor over speculation.
How do I know if my conclusion is overstated?
Apply the three-step diagnostic: check if your conclusion exceeds your data’s scope, whether you have verified causation rather than assumed it, and whether the effect size justifies your recommendation with complete baseline information. If any step fails, qualify your language.
Does this framework apply to the Quiz Bowl round as well?
Match the requested answer format. For a factual question, give the supported answer directly; for an open analysis question, distinguish the observed result from the mechanism it might suggest. Add a limitation where it changes the conclusion, rather than treating qualification itself as a scoring tactic.